
Power Calculations
Power calculations are a statistical tool to help compute sample size, power, or minimum detectable effect size (MDES). They are a key process in conducting high quality randomized control trials and should be computed at the impact evaluation design stage using Stata. This page covers what data and key parameters are used in power calculations. .
Read First
- Power calculations can be used in three ways :
- To compute sample size, given power and minimum detectable effect size (MDES)
- To compute power, given sample size and MDES
- To compute MDES, given power and sample size.
- The danger of underpowered evaluations by J-PAL details how underpowered calculations can affect study outcomes.
- To calculate sample size with power calculations, you need to know the MDES, the standard deviation of the population outcome, and the Type I and Type II significance levels. For clustered samples, you need to also know the intra-cluster correlation and the average cluster size.
- A sample that is too small will not permit you to detect a statistically significant effect, while a sample too large may be a waste of limited resources. When choosing sample size, consider the marginal value of added observations or, in other words, the trade-offs between accuracy and cost.
- For detailed instructions on implementing power calculations, see Power Calculations in Stata and, as a compliment, Power Calculations in Optimal Design.
Sample Size vs. Minimum Detectable Effect vs. Power
Power calculations can be used to calculate sample size, power, or MDES.
- To compute sample size, you must input power and MDES
- To compute power, you must input sample size and MDES
- To compute MDES, you must input power and sample size.
As power is typically set at 0.80, power calculations are usually used to compute either sample size or MDES. When deciding which to estimate, consider the research design and constraints of a specific evaluation. You may ask yourself:
- Given that I want to be able to statistically distinguish program impact of a 10% change in my outcome of interest, what is the minimum sample size needed?
- Given that I only have budget to sample 1,000 households, what is the minimum effect size that I will be able to distinguish from a null effect?
Questions like the first are answered by sample size while questions like the second are answered by MDES.
Data for Power Calculations
You will likely never have all the data you need for your exact population of interest when you first compute power calculations. You will need to use the best available data to estimate values for each parameter. You may consider using a high-quality nationally representative survey (i.e. LSMS) or data from DIME impact evaluation in same region or country. If you are calculating sample size, then you will need to input MDES. To decide which MDES value to use, review the literature – especially published papers on the sector and country. Note the effect sizes in past experiments and consider the minimum effect size that would hold policy relevance. If you can’t come up with a specific value with which you feel very confident, run a few different power calculations with alternate assumptions and create bounded estimates.
Key Parameters
The sample size formula, below, relies largely on the minimum detectable effect size, the standard deviation in population outcome, and the Type I and Type II significance levels. These variables are represented in the formula by D, σ, α, and β, respectively. Details of each variable follow. See the intuition and relationship behind parameters and sample size here .
 .
.
Minimum Detectable Effect Size
The minimum detectable effect size is the effect size below which we cannot precisely distinguish the effect from zero, even if it exists. If a researcher sets MDES to 10%, for example, they may not be able to distinguish a 7% increase in income from a null effect. To be clear, MDES is not the effect size we expect or want. However, to select MDES, it is important to consider the expected effect size. For example, if a program is expected to raise incomes by a minimum of 10%, it may not be necessary to have the option to distinguish program impacts of less than 10% from a null effect.
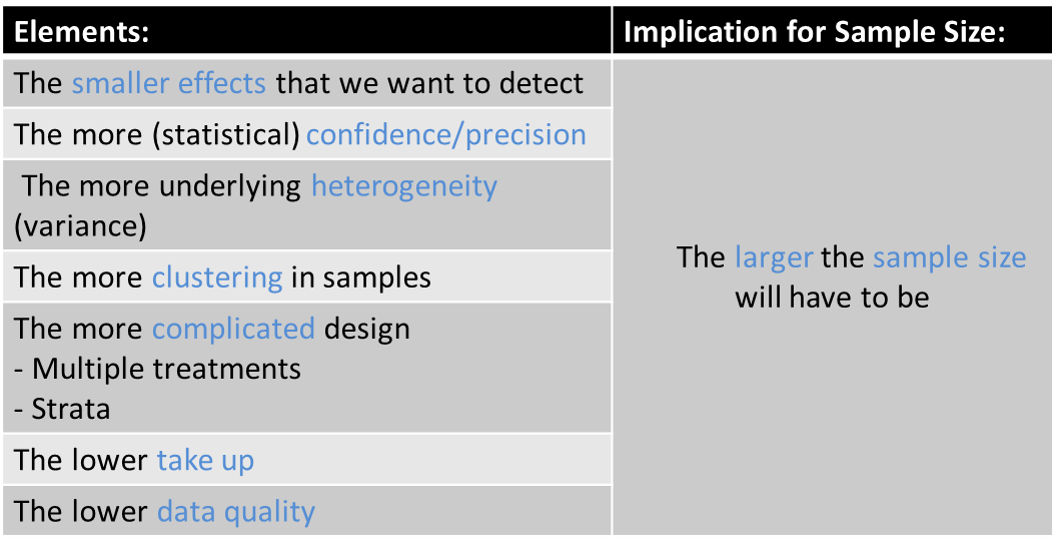
As the MDES increases, the necessary sample size decreases.
Standard Deviation of Population Outcome
The standard deviation of population outcome measures the variability of the data. As the standard deviation in a population increases, so does the necessary sample size. Consider, for example, a researcher who is studying the effect of an intervention on household income. Within the city of interest, household incomes range from 15,000 USD to 200,000 USD and standard deviation is quite large. Since the standard deviation is large, the researcher needs a larger sample size to detect an effect of the intervention.
Statistical Confidence / Precision
Type I errors occur when the null hypothesis is true but is rejected (otherwise known as a false positive). Type II errors occur when the null hypothesis is false but erroneously fails to be rejected (otherwise known as a false negative). To calculate necessary sample size, power calculations require that you specify the Type I and Type II significance levels. Typically, researchers set Type I significance level (α) to 0.05 and Type II significance level, or power, to 0.80 .
The greater precision desired, the larger the sample size required.
Sample Size
If using power calculations to compute power or MDES for an un-clustered design, you will need to input the sample size (n).
Additional Parameters for Clustered Sampling
When calculating sample sizes for a clustered sample, the sample size formula includes an inflation factor called the “design effect,” outlined in green in the formula below. The design effect relies on two additional variables: the intra-cluster correlation (ICC) and the average cluster size. These variables are represented by ρ and m, respectively, in the formula below. Details of each variable follow.
.png)
Intra-Cluster correlation
Intra-cluster correlation is the proportion of the total sample variation explained by within cluster level variance. When within cluster variance is high, within cluster correlation is low and between cluster correlation is high. As the intra-cluster correlation increases, the necessary sample size increases.
Average Cluster Size
As the number of units per cluster increases, the necessary sample size increases. The sample size formula above is most accurate when all clusters are of equal size.
Indirect Effects on Sample Size
Baseline Correlation of Outcome with Covariates
Covariates (individual and/or cluster level) reduce the residual variance of the outcome variable, leading to lower required sample sizes. Note that reducing individual level residual variance is akin to increasing the number observations per cluster (bigger effect if ICC low), while reducing cluster level residual variance is akin to increasing the number of clusters (bigger effect if ICC and m high). If you have baseline data, this is easy to obtain. Including baseline autocorrelation will improve power as it maintains only the time invariant variance.
Take-up
If the program take-up is low, then the observed effect in the treatment group is lower. Effectively, a lower proportion of compliers dilutes MDE. For example, if program take-up rate is 50%, the observed effect in treatment group is half the size when compared to a 100% take-up rate. If MDES is half the size, the necessary sample size quadruples.
Data Quality
Poor data quality (i.e. missing observations, measurement error) also increases the necessary sample size. The best way to avoid poor data quality is proactively by training enumerators effectively, creating and implementing a data quality assurance plan, monitoring data quality in the field, and conducting back checks and high frequency checks. Ideally, a field coordinator will be on the ground monitoring data collection.
Computing Power Calculations
All sampling code you produce must be reproducible. For information on how to compute power calculations in Stata, see Power Calculations in Stata. For a visualization of the trade-offs associated with parameters in power calculations, consider complementing Stata with Optimal Design.
Back to Parent
This article is part of the topic Sampling & Power Calculations
Additional Resources
- DIME Analytics (World Bank), Guidelines on sample size and power calculations 1
- DIME Analytics (World Bank), Guidelines on sample size and power calculations 2
- World Bank Development Blog: Ozler’s Power Calculations: What software should I use?
- Gelman’s Sample Size and Power Calculations
- Katreniak’s Power Calculations
- JPAL’s Slides
- Gelman’s Why it makes sense to revisit power calculations after data has been collected